On Our Mind
As we wrap up a week filled with numerous headlines on GDP growth, politics, admission policies, and numerous earnings reports, we promulgate what has drawn our attention at Noble Wealth Partners.
Comparing the number of cranes at the end of the year in 2016 to 2017, we postulate that Denver is winding down construction with seven less cranes operating at the end of the year. Meanwhile, Seattle and Chicago appear to be building.:

2016

2017
We are officially in the midst of the longest period a 60% equity and 40% bond portfolio has gone without a 10% drawdown going back to 1900. Are we due for a drop? The lack of a decline is not a reason to expect one, there must be another catalyst.

Like the tech bubble, this expansion has rewarded speculators ignoring the fundamentals. Seen below, where an index of companies with weaker balance sheets and more debt have outperformed this expansion.

And, companies that focus on future growth expectations have outperformed those with tried-and-true business models by one of the largest margins on record.

Maybe the Great Recession did not scar investors as much as pundits may claim…
The current spread between 10 and 2-year Treasuries points to a rocky road ahead. Is it a good time to buy protection on your portfolio?

Has the yield curve lost its predictive capabilities? Professional money managers don’t seem to think so as the majority are forecasting a recession right around the time the yield curve may invert.

Yet, they seem to be more afraid of geopolitical risks and trade rhetoric than the yield curve right now.

Finally, investors are rewarding companies with positive results at levels close to the 5-year average. However, investors have been punishing those that underwhelm the market.

European economic data continues to be unimpressive. The recent Purchasing Manager Survey points to GDP growth of ~2% on an annualized basis in the Eurozone.

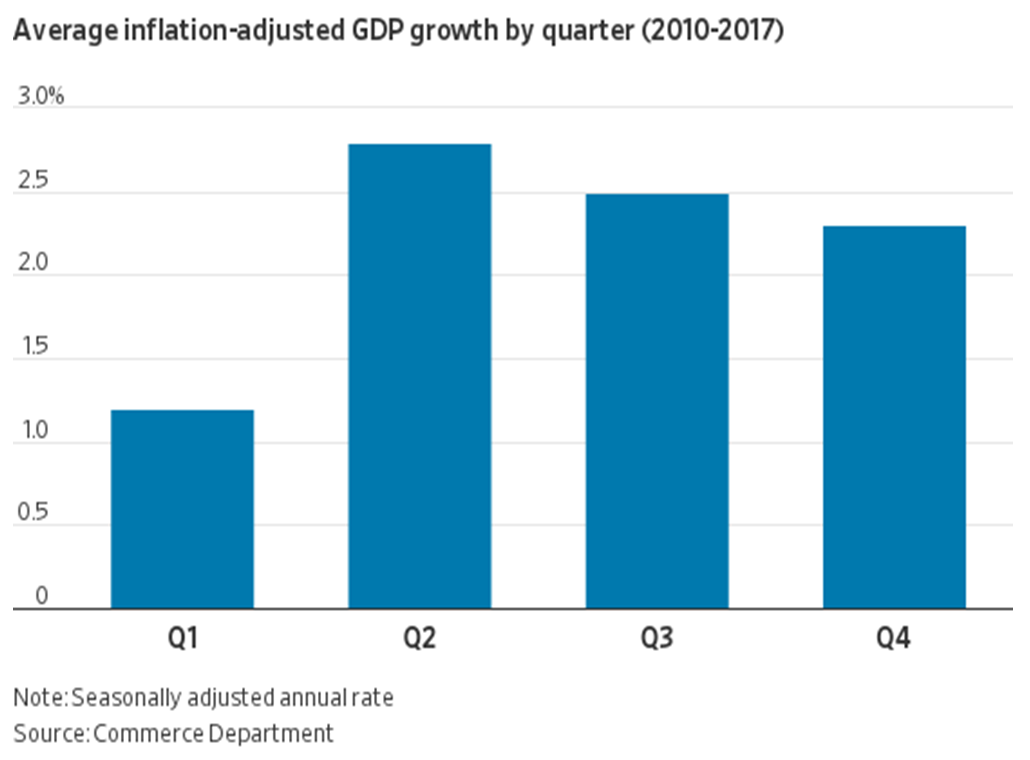
On Friday, we received a strong GDP print of 4.1% for the second quarter. Don’t start tweeting just yet, a strong second quarter has been a normal occurrence since 2010 as the U.S Bureau of Economic Analysis continues to solve the seasonality riddle that has been a thorn in their side since 2010.
And finally, housing fundamentals remain intact with a strong labor market, household formation growth, low inventory, and declining vacancy rates.


Although, prices have waned over the past year and investors may be taking their chips off the table as mortgage rates climb.


